Do Easier-to-Read Papers Get More Citations? A Flesch Reading Ease Analysis of 26,439 Papers Across 26 Fields
Open access
Preprint
Highlights
In 26,439 open-access papers across all 26 fields, abstracts that are harder to read receive more citations.
Each 10-point rise in Flesch Reading Ease goes with 14% fewer citations, or 5.4% fewer after controls.
Compared within the same journal, the gap largely disappears (0.9% per 10 points, not significant).
Abstracts became sharply harder to read after 2023: mean Flesch Reading Ease fell from about 23 to 15.3 in 2025.
The drop comes from longer words, and tracks a rise in AI-style vocabulary from 2.6% of abstracts in 2022 to 11.4% in 2025.
Abstract
Do easier-to-read papers get cited more? In a stratified random sample of 26,439 open-access research articles (2015 to 2025, all 26 OpenAlex fields, 10,366 journals), the answer is no. Abstracts that are harder to read, measured by the Flesch Reading Ease (FRE) score, receive more citations.
Comparing papers from the same field and year, each 10-point rise in FRE goes with 14% fewer citations, or 5.4% fewer (95% CI 4.1% to 6.6%) after allowing for abstract length, author count and reference count. The hardest-to-read fifth of abstracts is almost twice as likely to reach the top 10% most-cited papers as the easiest fifth (33.7% vs 18.7%). The link is significantly negative in 23 of 26 fields, and no field shows the reverse. The driver is word length, not sentence length.
However, the gap largely disappears when papers are compared within the same journal (0.9% per 10 points, not significant). Harder abstracts are cited more mainly because they appear in more technical, more cited journals, not because dense writing itself attracts citations.
Since 2023, abstracts have become sharply harder to read. Mean FRE was flat at about 23 from 2015 to 2022, then fell to 15.3 in 2025. The change comes from longer words, and it tracks a rise in vocabulary linked to AI writing tools (“underscore”, “pivotal”, “intricate”, “delve”). The share of abstracts using these words rose from 2.6% in 2022 to 11.4% in 2025. The drop holds within the same journals, on a second readability measure (Dale-Chall), and after the AI-style words themselves are removed.
Keywords
- Readability
- Flesch Reading Ease
- Citations
- Scientometrics
- Large language models
- Academic writing
1. Introduction
Scientists are often told to write more clearly. Style guides, journal editors and writing courses all make the same promise: a clear abstract reaches more readers, and more readers means more citations. This study tests that promise at scale.
The question matters more now than it did five years ago. Since ChatGPT’s release in November 2022, AI writing tools have become part of how many researchers draft and polish their work. These tools change word choice in ways that are easy to measure. If readability affects citations, then tools that change readability could also change how research is found and used.
Earlier work points in several directions. Plavén-Sigray and colleagues (2017) scored 709,577 abstracts from 123 journals published between 1881 and 2015, and found they have become steadily harder to read, largely because of more scientific jargon. Smaller studies of the link between readability and citations, usually within one discipline or a few journals, have reported mixed results. More readable abstracts were cited more in economics (Dowling et al., 2018), while no link was found in information science (Lei and Yan, 2016). Separately, Kobak and colleagues (2025) and Liang and colleagues (2024) showed a sharp rise after 2022 in words favoured by large language models, such as “delve” and “pivotal”, which they used to estimate how much academic writing is now AI-assisted.
This paper brings these threads together in one cross-disciplinary sample. It asks four questions:
RQ1. Do abstracts that are easier to read receive more citations?
RQ2. Does this relationship differ between disciplines?
RQ3. Has abstract readability changed since 2023, when AI writing tools became widespread?
RQ4. Has the link between readability and citations changed since 2023, and are abstracts with AI-style vocabulary cited differently?
2. Data and methods

Figure 1. How the sample was built, from the OpenAlex pull to the main analysis sample.
2.1 Sample
Data come from OpenAlex, a free, fully open index of scholarly works (Priem et al., 2022). The sample was drawn on 23 September 2026. It is stratified by OpenAlex’s 26 research fields and by publication year from 2015 to 2025. For each of the 286 field-year cells, 150 papers were drawn at random using OpenAlex’s seeded sample function, giving 42,900 papers. The filters below were applied before sampling, so every cell holds 150 papers that meet them. Every field and year has equal weight, so small fields are not swamped by Medicine or Engineering.
All papers met six filters: journal article, open access, English, has an abstract, not retracted, and not front matter such as editorials or covers.
2.2 Cleaning
Abstracts in OpenAlex are stored as word-position indexes. Each was rebuilt into plain text, then cleaned of HTML tags, LaTeX, links, copyright lines and labels such as “Abstract”. Structured-abstract headings (“BACKGROUND:”, “METHODS:”) were turned into sentence breaks, since without a full stop they would join two sentences into one and make the text look harder than it is.
Abstracts under 50 or over 600 words, or mostly non-English characters, were dropped, leaving 39,419 papers. The main sample then keeps only papers that look like full research articles: at least 10 references, an abstract of 100 to 400 words, and no book reviews, corrections, commentaries or replies. This leaves 26,439 papers from 10,366 journals. Results for the wider 39,419-paper sample are reported as a check.
2.3 Readability
The main measure is the Flesch Reading Ease score:
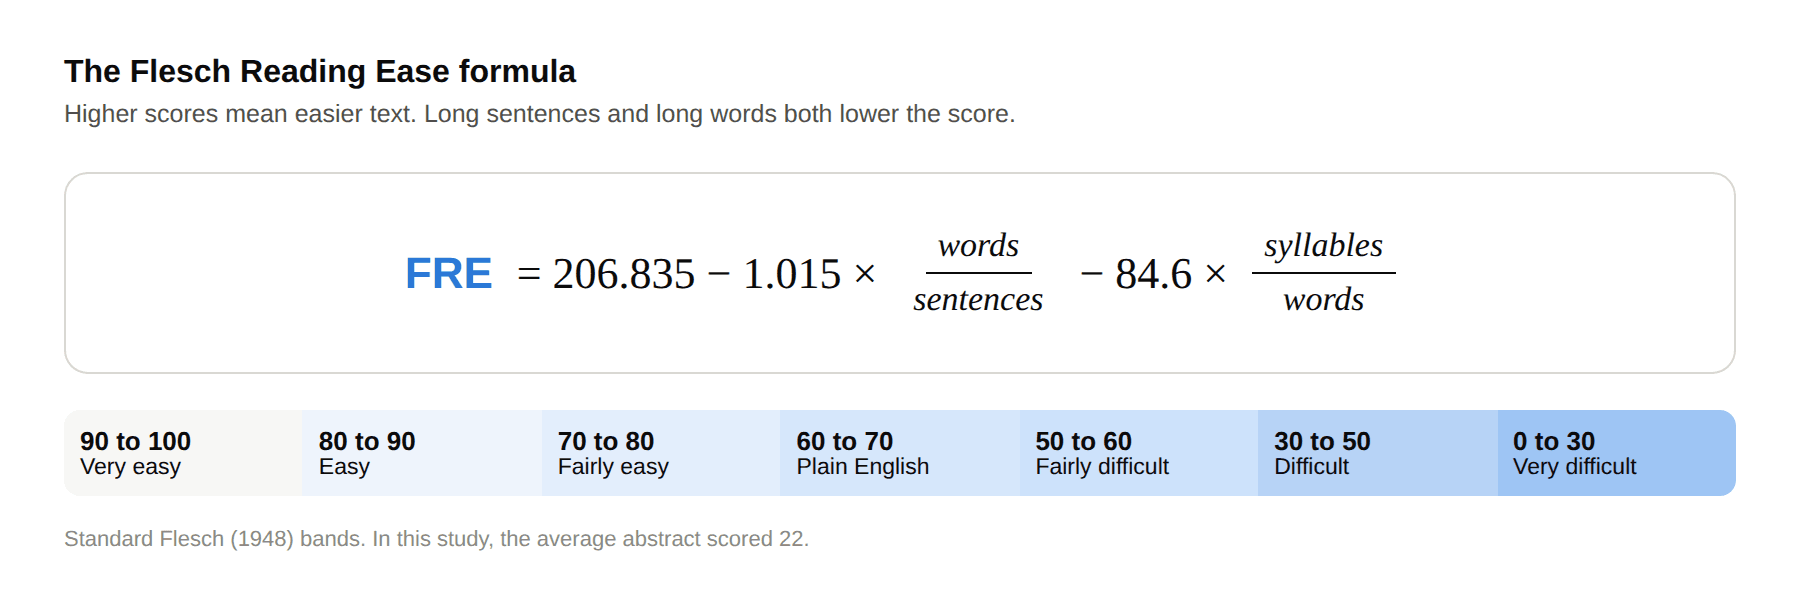
Figure 2. The Flesch Reading Ease formula and standard score bands.
Higher scores mean easier text. Scores of 60 to 70 suit a general adult reader; below 30 is “very difficult”, roughly graduate level. Syllables were counted with the CMU Pronouncing Dictionary through the textstat Python package. The two parts of the formula, words per sentence and syllables per word, were also analysed on their own. Two other measures were used as checks: the Flesch-Kincaid grade level, and the Dale-Chall score, which judges difficulty by the share of words outside a list of about 3,000 familiar words rather than by counting syllables. To limit the effect of a few badly split texts, all three measures were capped at their 1st and 99th percentiles.
How to read a Flesch score
Flesch Reading Ease scores usually run from 0 to 100. Higher scores mean easier text. The standard bands are:
Score | Reading level | Typical reader |
|---|---|---|
90 to 100 | Very easy | Age 11 |
80 to 90 | Easy | Age 12 |
70 to 80 | Fairly easy | Age 13 |
60 to 70 | Plain English | Age 13 to 15 |
50 to 60 | Fairly difficult | Age 15 to 18 |
30 to 50 | Difficult | University student |
0 to 30 | Very difficult | University graduate |
Very dense text can score below 0. The average abstract in this study scored 22, in the “very difficult” band.
2.4 AI-style vocabulary
To track AI writing, each abstract was checked for 37 word forms that past studies found became much more common after ChatGPT’s release, such as “delve”, “underscore”, “pivotal”, “intricate”, “showcase” and “meticulous”. These are style words, not topic words. The count works as a signal across thousands of papers. It cannot show that any single paper used AI. The full list is in Appendix A. It was compiled by the author, guided by the words these studies highlighted, and is not a copy of either study’s published list.
2.5 Citation measures
Citations were measured three ways, because raw counts depend heavily on a paper’s age and field:
Total citations, log-transformed, always compared within the same field and year.
OpenAlex citation percentile, which ranks each paper against others of the same field, year and type (0 to 100).
Citations in the first two calendar years, a fixed window that treats old and new papers equally.
Citation analyses for RQ1 and RQ2 use papers from 2015 to 2022 (19,057 in the main sample), so that each has had at least three years to be cited.
2.6 Models
The main model is an ordinary least squares regression of log citations on FRE, with a separate intercept for every field-year cell. Controls are abstract length, number of authors and number of references, all logged. Standard errors are clustered by journal. A second version adds journal fixed effects, which compares papers only against others in the same journal. For RQ3, an interrupted time series estimates the pre-2023 trend, a jump in 2023 and a change in slope after 2023, with field fixed effects. For RQ4, the citation-percentile model for papers from 2019 to 2025 adds an interaction between FRE and a 2023-or-later indicator; the field-year intercepts absorb the indicator itself. A separate model for 2023 to 2025 papers adds an indicator for any AI-style word.
3. Results
Abstracts in the main sample are hard to read. The mean FRE is 22.0, and 70% of abstracts score below 30, the “very difficult” band. The average abstract has 206 words, 21.6 words per sentence and 1.92 syllables per word.
3.1 Harder abstracts are cited more (RQ1)
The hardest-to-read fifth of abstracts is almost twice as likely as the easiest fifth to reach the top 10% most-cited papers of its field and year.
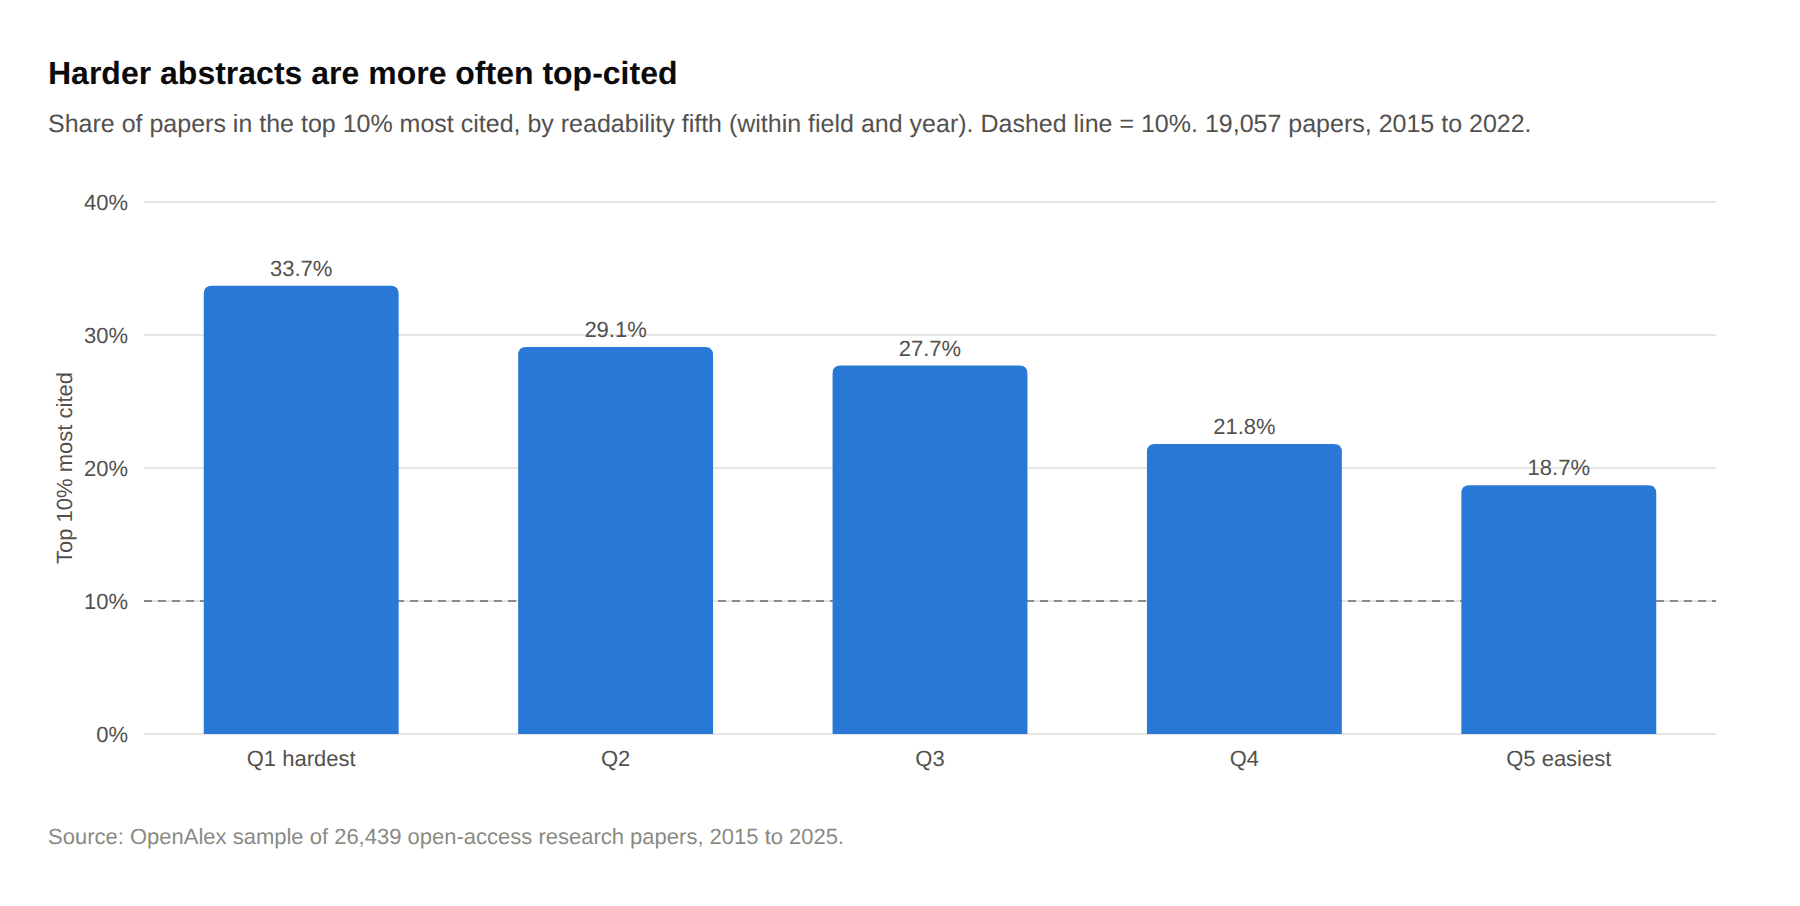
Figure 3. Main sample, papers from 2015 to 2022 (n = 19,057)
The same slope appears in all four broad domains. It is steepest in the Life Sciences, where mean citation percentile falls 16 points from the hardest to the easiest fifth.
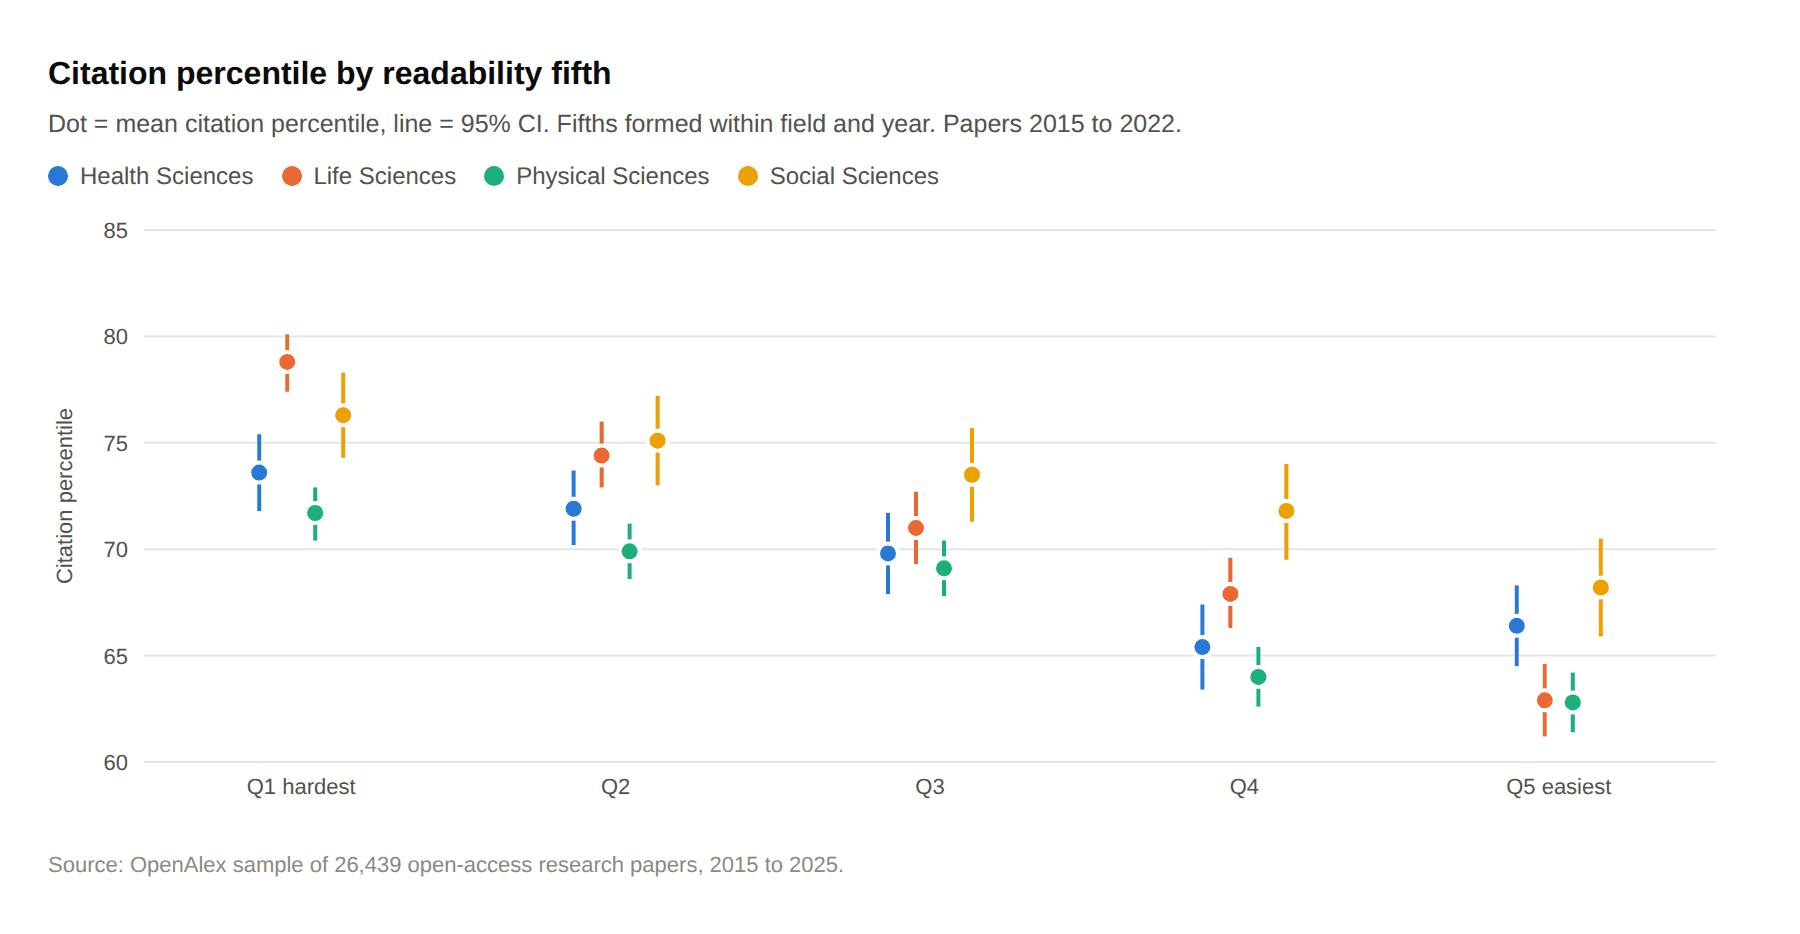
Figure 4. Main sample, papers from 2015 to 2022, by OpenAlex domain
Table 1 shows that the link survives controls for abstract length, author count and reference count, and holds for every citation measure. The key exception is the within-journal model. Once each paper is compared only with others from the same journal, the effect shrinks to under 1% and is no longer significant.
Table 1. Effect of a 10-point rise in Flesch Reading Ease on citations (papers 2015 to 2022)
Model | Main sample (n = 19,057) | Wider sample, 2015 to 2022 (n = 28,343) |
|---|---|---|
Same field and year, no controls | -14.3% (-15.7 to -12.8) | -14.5% (-15.9 to -13.2) |
+ length, authors, references | -5.4% (-6.6 to -4.1) | -6.8% (-7.8 to -5.8) |
Citation percentile, points | -1.10 (-1.38 to -0.83) | -1.33 (-1.56 to -1.10) |
Citations in first 2 years | -4.2% (-5.3 to -3.1) | -5.4% (-6.2 to -4.6) |
Within the same journal | -0.9% (-2.4 to +0.6), n.s. | -2.2% (-3.4 to -1.0) |
Both columns use papers from 2015 to 2022 only, which is why the wider sample here is smaller than its full 39,419. Figures in brackets are 95% confidence intervals, with standard errors clustered by journal. n.s. = not significant at p < 0.05. The within-journal models use journals with at least two papers in the sample (2,682 and 4,264 journals).
Word length drives the effect, not sentence length. In a model with both parts of the FRE formula, each extra 0.1 syllables per word goes with 5.2% more citations (p < 0.001). Each extra word per sentence goes with only 0.4% more (p = 0.008).
Reference count does most of the work in shrinking the effect from 14.3% to 5.4%. Adding it alone brings the estimate to 4.8%, while abstract length and author count barely move it. Papers with harder abstracts cite more sources (Spearman rho = -0.25 between FRE and reference count). Reference count may partly be a result of a paper being technical rather than a separate cause of citations, so the true link may lie between the two estimates.
The journal explanation for the gap holds up when tested directly. Across the 2,682 journals with at least two papers, journals whose abstracts are 10 points easier on average sit 6.6 percentile points lower on citations (95% CI 5.6 to 7.6), after adjusting for field and year. Splitting the overall link between readability and citations into its parts, 85% of it lies between journals and only 15% within them.
A second readability measure gives the same answer. On the Dale-Chall score, where higher means harder, each extra point goes with 6.1% more citations (95% CI 4.1% to 8.2%), with the same controls.
3.2 The pattern holds in almost every field (RQ2)
The correlation between readability and citation percentile is negative and significant in 23 of 26 fields. In the other three (Social Sciences, Physics and Astronomy, and Economics and Finance) it is close to zero. No field shows easier abstracts being cited more.
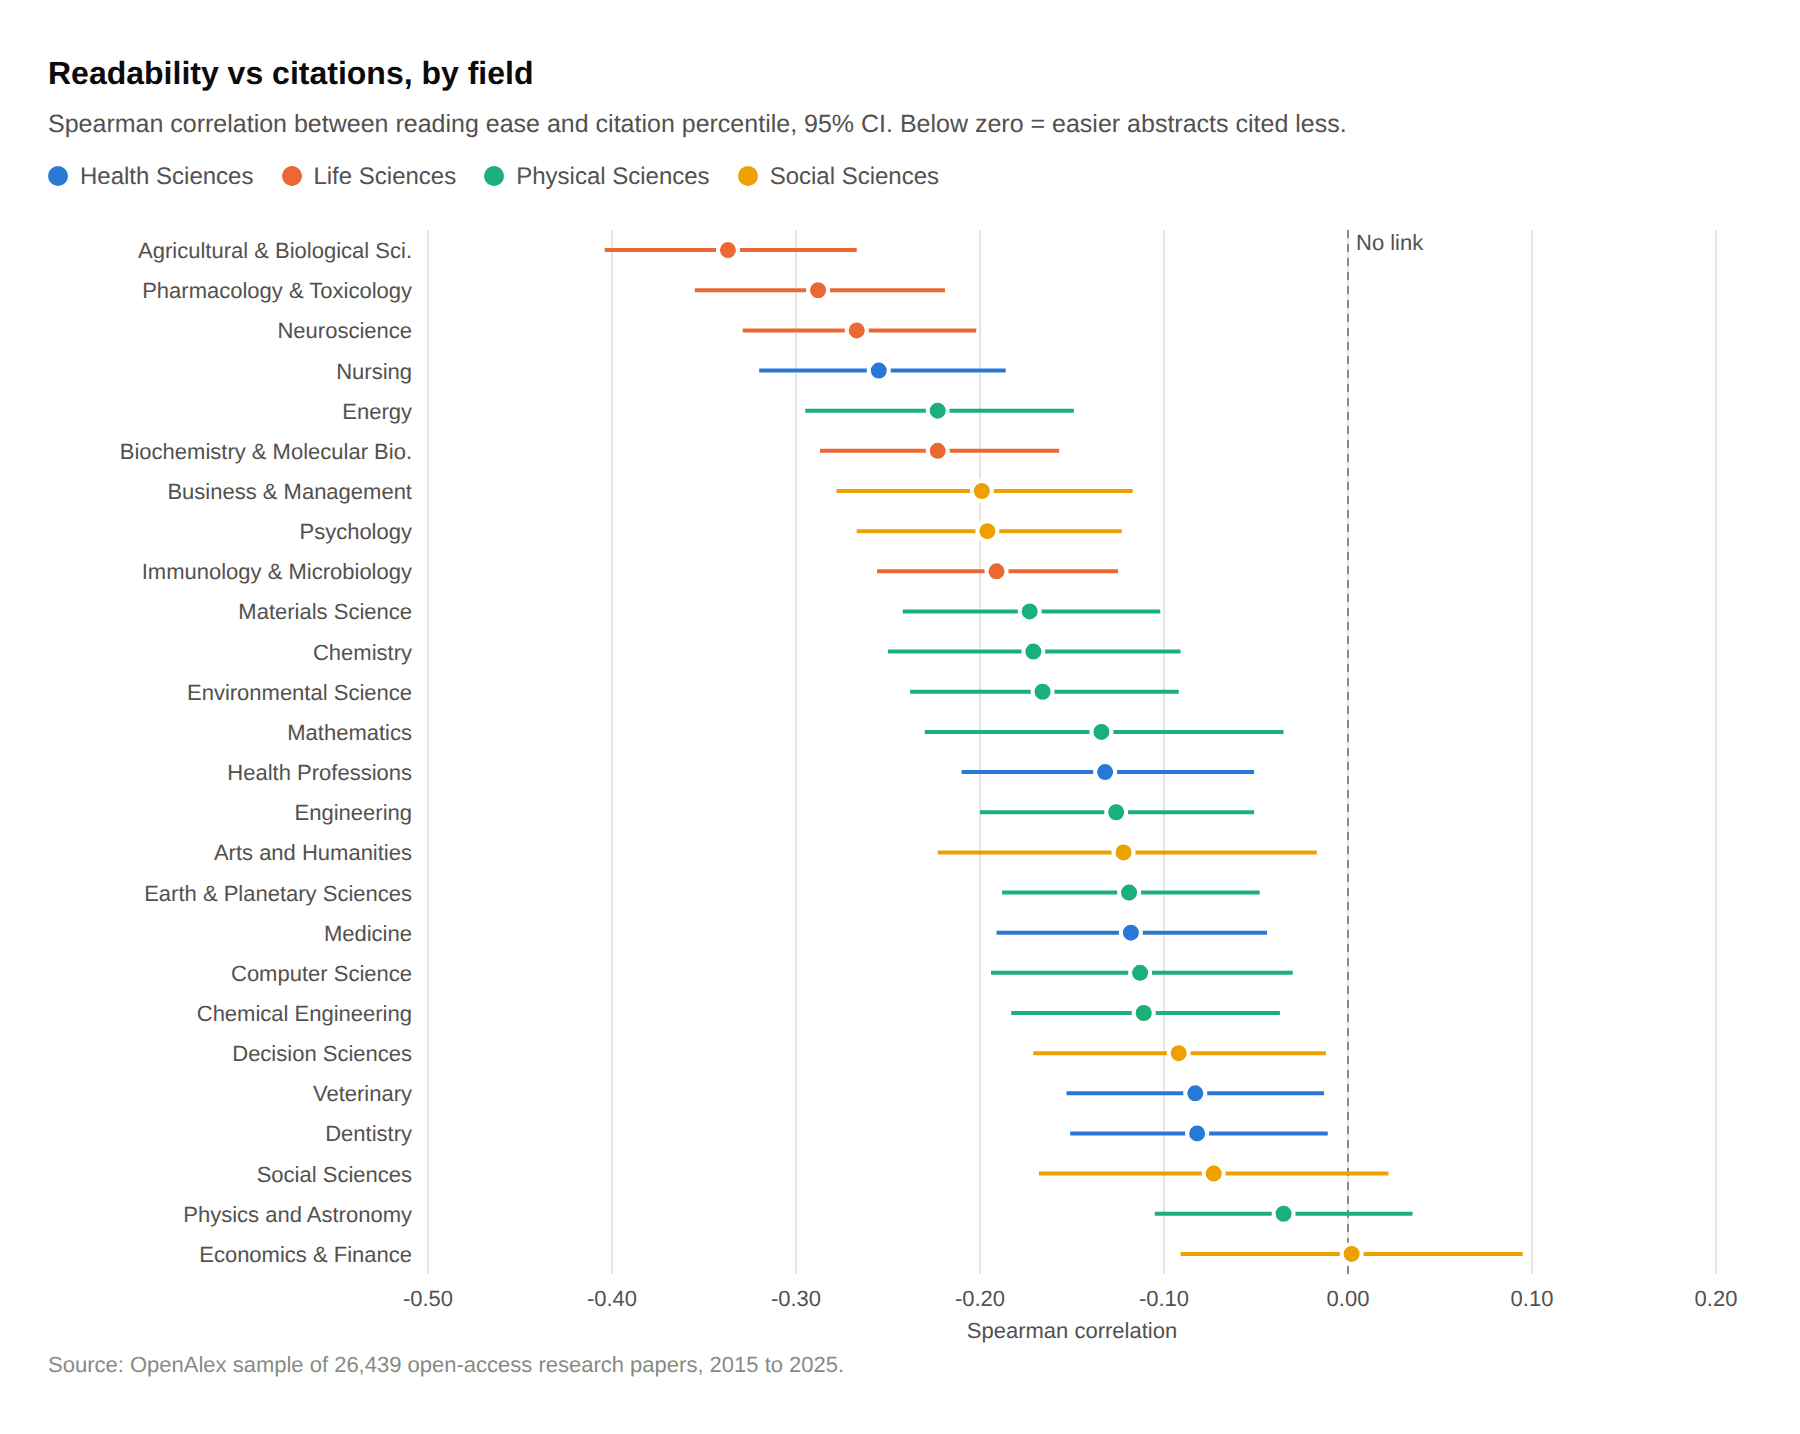
Figure 5. Main sample, papers from 2015 to 2022, 395 to 933 papers per field
The link is strongest in the life sciences: Agricultural and Biological Sciences (rho = -0.34), Pharmacology (-0.29) and Neuroscience (-0.27). It is weakest in Economics and in Physics and Astronomy. Fields also differ in how readable their abstracts are. Dentistry and Veterinary abstracts are the easiest (mean FRE about 31), while Business, Decision Sciences and Neuroscience are the hardest (about 18).
3.3 Abstracts became much harder to read after 2023 (RQ3)
Abstract readability was flat from 2015 to 2022, at a mean FRE of about 23. It then fell to 22.0 in 2023, 19.5 in 2024 and 15.3 in 2025. The 2025 drop of nearly 8 points is about half a standard deviation, and it appears in all four domains.
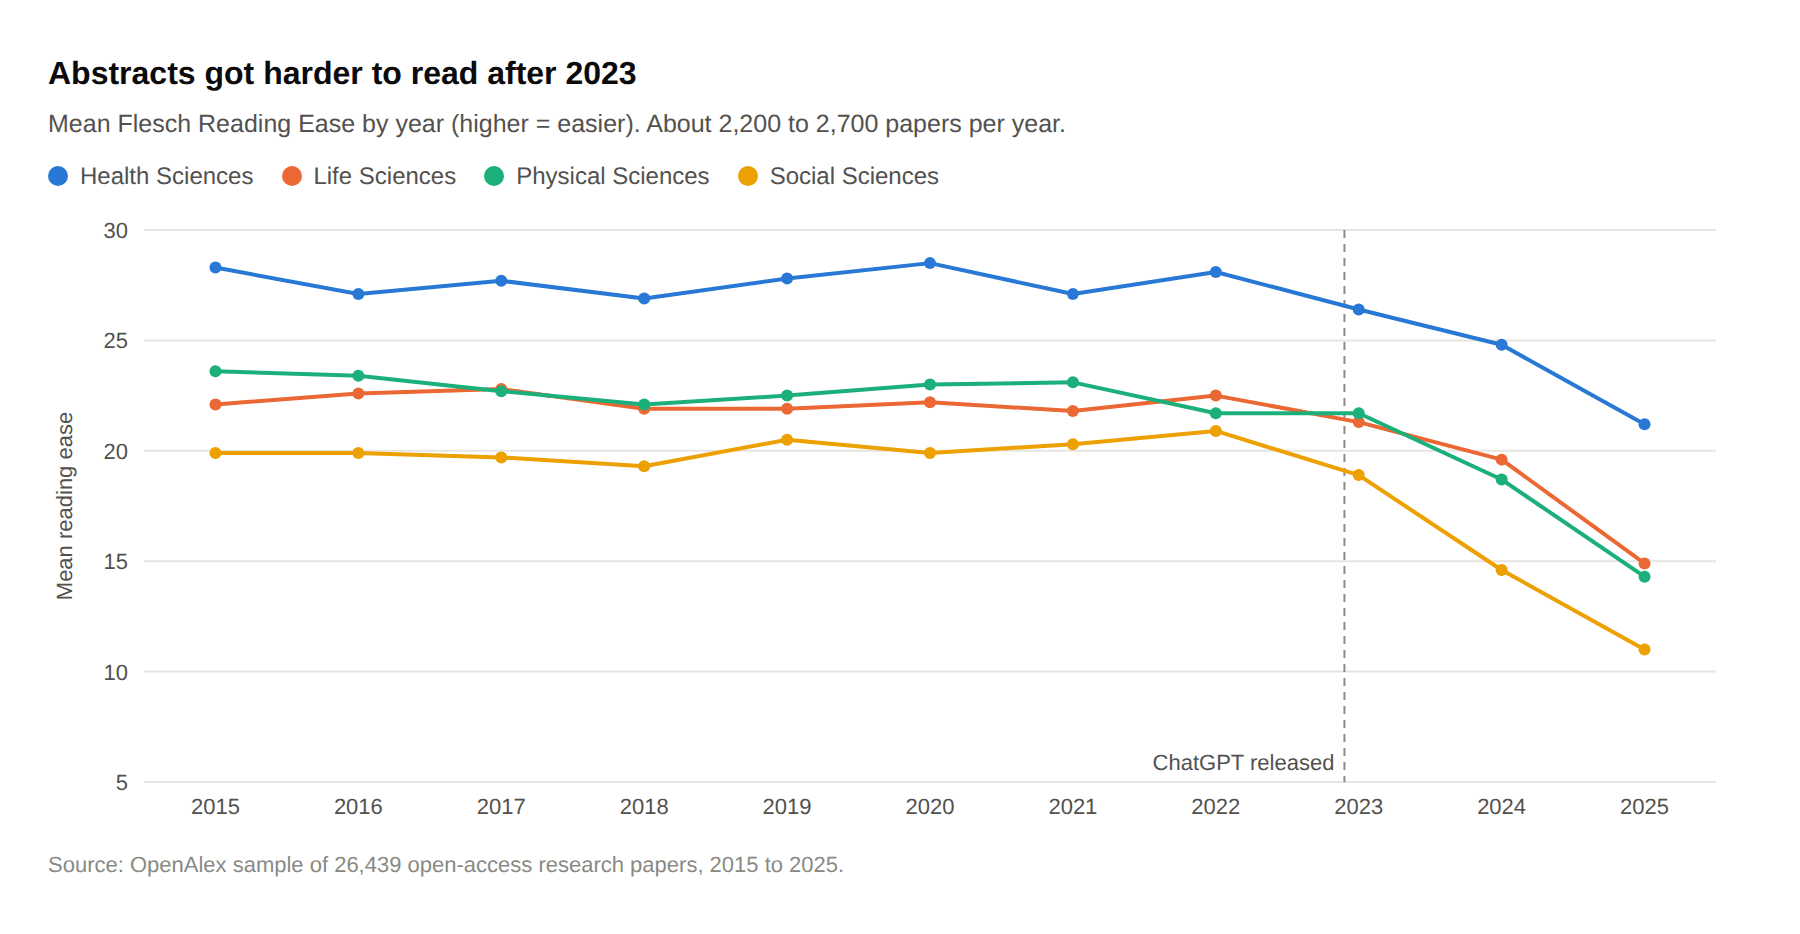
Figure 6. Main sample, all years (n = 26,439)
The interrupted time series confirms the break. Before 2023 the trend was flat (-0.03 FRE per year, p = 0.54). After 2023 the slope turned sharply downward, by 3.4 points per year (95% CI 3.0 to 3.8, p < 0.001). The Social Sciences fell furthest, from 20.9 in 2022 to 11.0 in 2025.
The decline comes from longer words, not longer sentences. Syllables per word rose from 1.91 in 2022 to 2.01 in 2025, while sentences actually became slightly shorter (21.7 to 21.0 words).
The drop is not caused by a change in which journals appear in the sample. Among 1,323 journals with papers both before and after 2023 (12,647 papers), abstracts in 2025 scored 7.2 points lower than abstracts in the same journals in 2022 (95% CI 6.1 to 8.3). About 87% of the overall fall happened within journals, and 66% of these journals became harder to read.
Over the same years, AI-style vocabulary spread quickly. The share of abstracts with at least one such word was steady at 2% to 3% until 2022, then rose to 4.2% in 2023, 10.1% in 2024 and 11.4% in 2025.
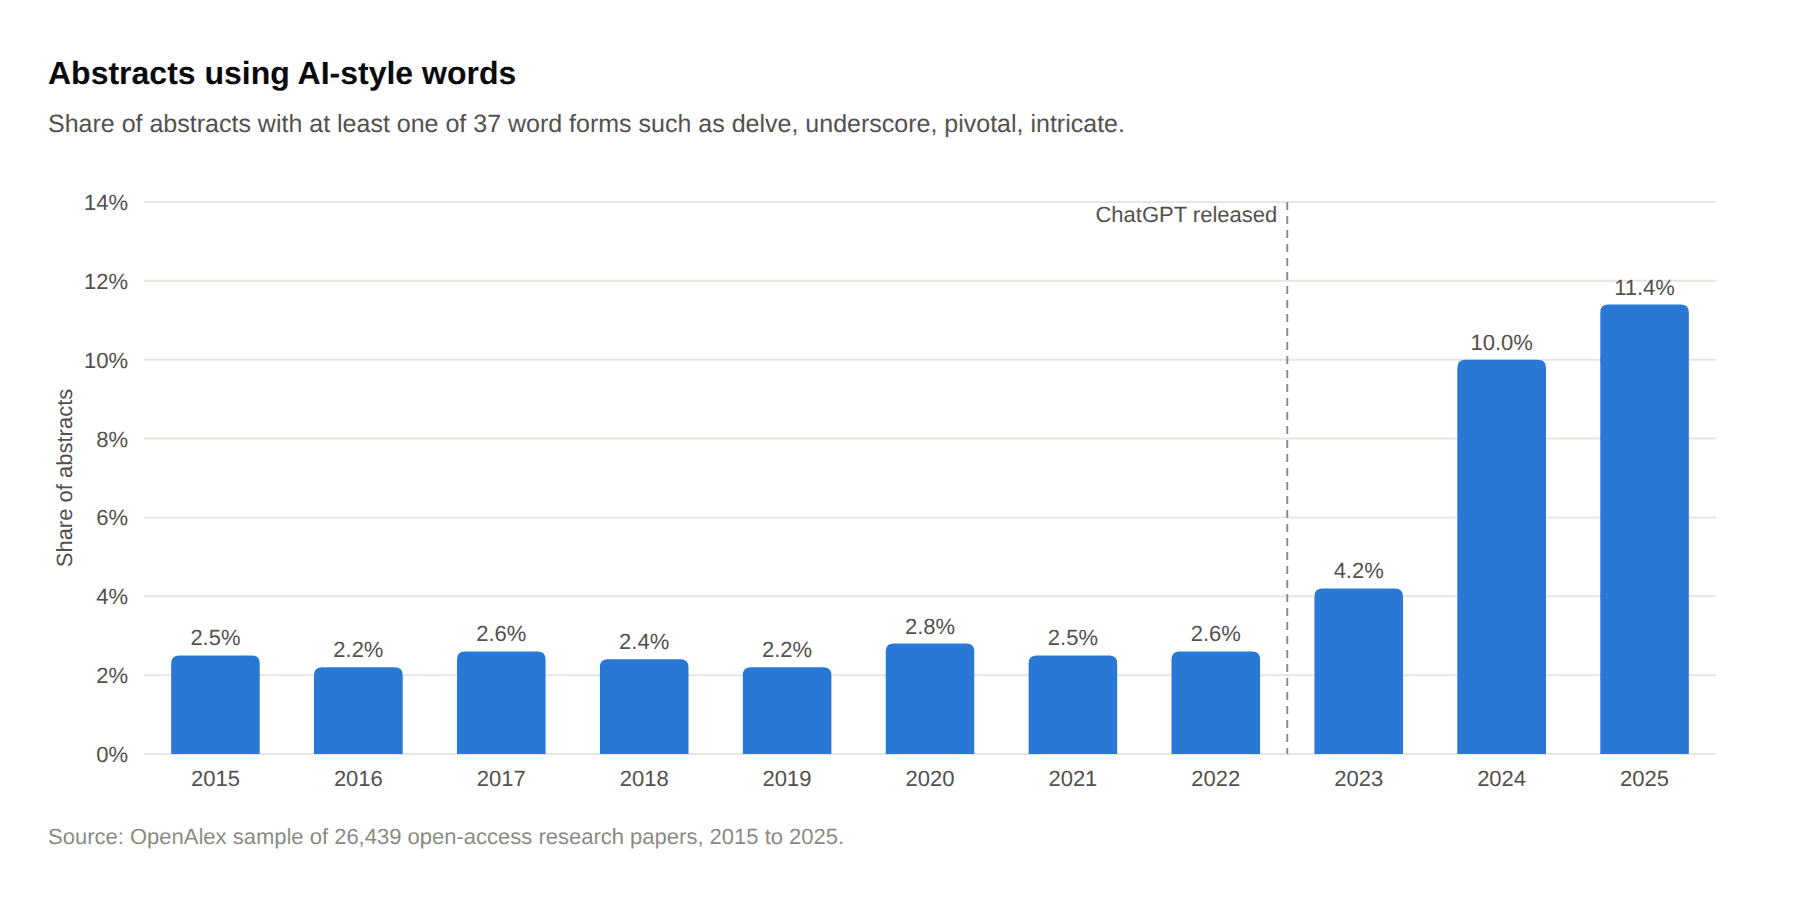
Figure 7. Main sample, all years (n = 26,439)
Table 2. The AI-style words that grew most (uses per 1,000 abstracts)
Word (all forms) | 2019 to 2022 | 2024 to 2025 | Change |
|---|---|---|---|
underscore | 2.5 | 44.3 | 18x |
pivotal | 4.4 | 19.6 | 4.5x |
elucidate | 7.2 | 13.2 | 1.8x |
intricate | 1.8 | 11.5 | 6.4x |
delve | 0.3 | 8.5 | 28x |
garner | 0.0 | 4.3 | new |
Abstracts that use these words are harder to read. Among 2023 to 2025 papers, abstracts with at least one AI-style word score 9.1 FRE points lower than others from the same field and year (p < 0.001). Removing the AI-style words and rescoring barely changes this (8.5 points lower), so the gap is not just the flagged words. This does not prove that AI tools caused the decline. But it shows that the kind of wording these tools favour and the fall in readability arrived together.
The decline holds across every check we ran (Table 3). Most importantly, it is not caused by the AI-style words themselves. Those words are long, so they lower the Flesch score on their own. But when they are removed and each abstract is rescored, 99% of the drop remains. The whole vocabulary of abstracts got longer, not just the flagged words.
Table 3. Checks on the post-2023 decline in readability
Check | Result |
|---|---|
Main measure: Flesch Reading Ease, 2025 vs 2015 to 2022 | 7.9 points harder (0.55 standard deviations) |
AI-style words removed before scoring | 7.9 points harder; 99% of the drop remains |
Dale-Chall score (word familiarity, not syllables) | 0.7 points harder (0.74 standard deviations) |
Flesch-Kincaid grade level | 1.0 grade higher (0.32 standard deviations) |
Within the same journals, 2024 to 2025 vs 2015 to 2022 | Flesch 5.1 points harder; Dale-Chall 0.45 points harder |
2023 treated as a transition year and left out | Slope change of -4.1 points per year (vs -3.4 with 2023) |
By open-access type | Drop appears in all five types (gold, diamond, hybrid, green, bronze) |
Structured abstracts (BACKGROUND, METHODS headings) | Share flat at 15% to 18% every year; allowing for it changes nothing |
All checks use the main sample of 26,439 papers.
3.4 Citations after 2023 (RQ4)
The link between readability and citations has stayed remarkably stable. In every year from 2015 to 2025, harder abstracts ranked higher on citations, with correlations between -0.12 and -0.18.
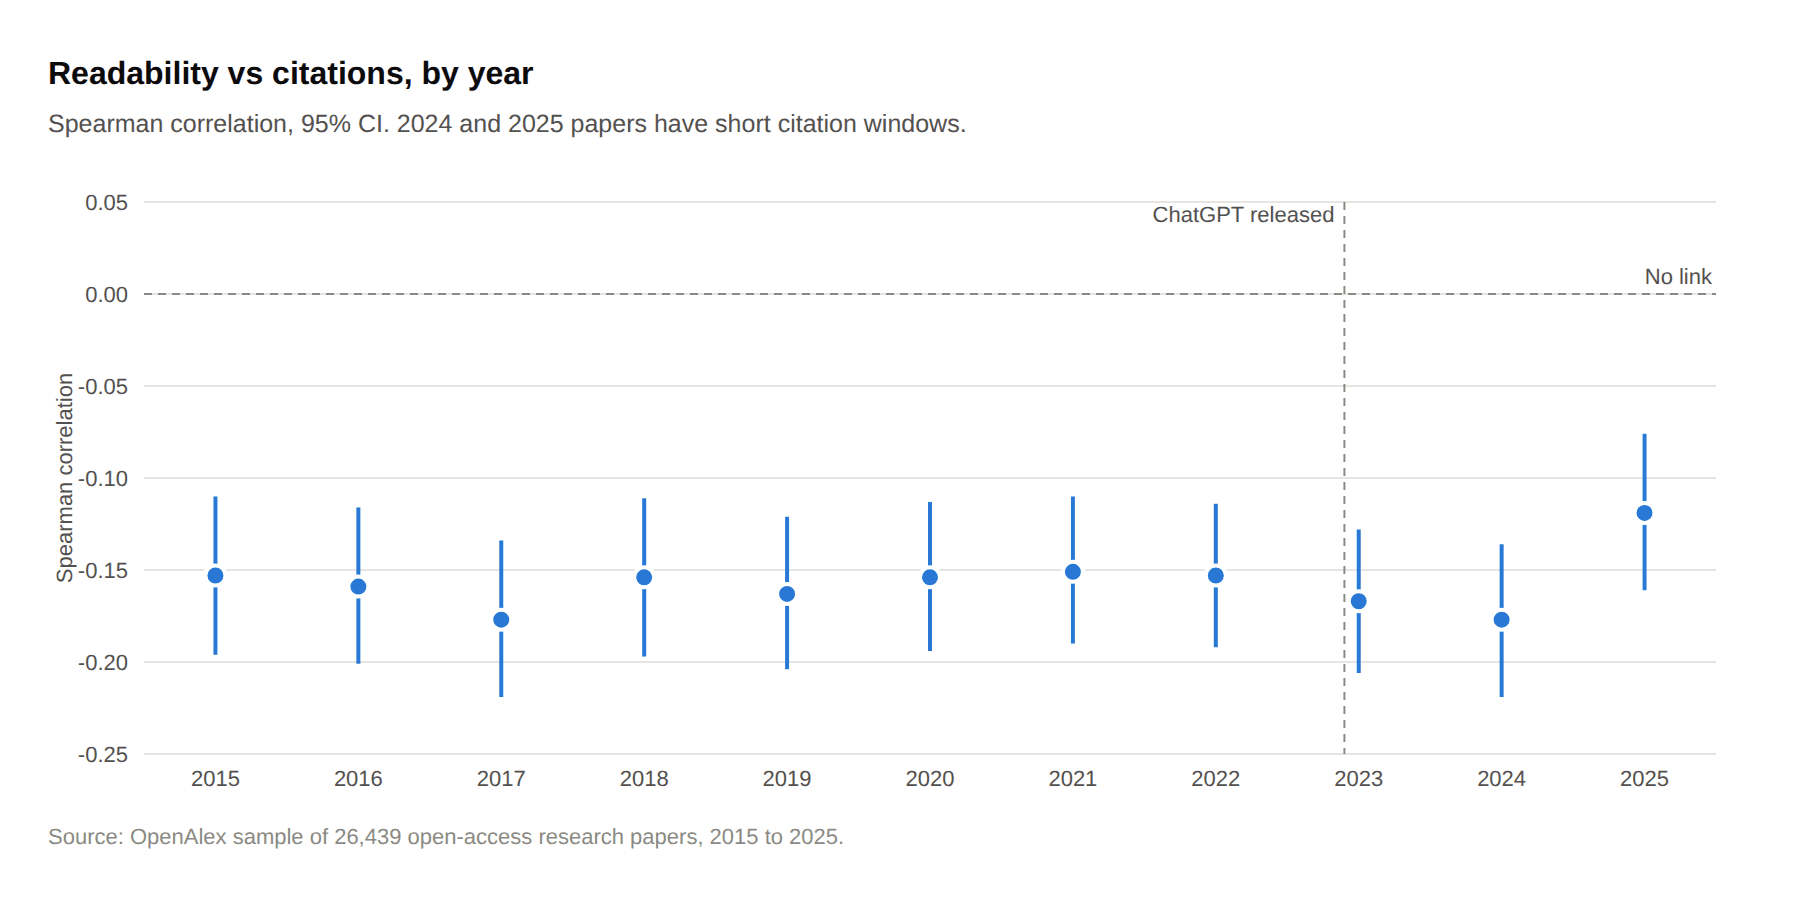
Figure 8. Main sample, all years (n = 26,439)
If anything, the link grew slightly stronger after 2023. For 2019 to 2022 papers, each 10-point rise in FRE lowered the citation percentile by 0.9 points. In the same model, which compares papers only within the same field and year, 2023 to 2025 papers show a further 0.7-point drop per 10 FRE points (interaction p = 0.014).
Abstracts with AI-style words are cited slightly more, not less. Among 2023 to 2025 papers, those with at least one such word sit 3.1 percentile points higher than others from the same field and year (95% CI 1.0 to 5.2, p = 0.004), after controlling for readability. For 2023 and 2024 papers, they also received 15.6% more citations in their first two years (95% CI 5.7% to 26.4%). These papers are young, so this is early evidence only.
4. Discussion
The common advice that clear writing earns citations finds no support here. Across 26 fields, harder abstracts are cited more. But the within-journal result changes what this means. Inside a given journal, readability makes almost no difference to citations. The gap comes from where papers are published.
4.1 Why harder abstracts are cited more
The journal-level test in Section 3.1 supports the explanation that dense, technical abstracts are a marker of a certain kind of paper and a certain kind of journal. Papers full of specialist terms tend to report new methods, compounds, genes or datasets. These are often published in large, well-cited specialist journals and are cited as building blocks by later work. Easier abstracts are more common in journals that serve practitioners or regional audiences, which are cited less.
The word-length result supports this. Long words are mostly technical terms (“immunohistochemistry”, “photocatalytic”). Sentence length, which reflects writing style more than subject matter, has almost no link to citations. In short, readability scores here partly measure how technical a paper’s subject is, not only how well it is written.
4.2 What this means for authors
The results do not suggest that authors should make their writing harder. Within the same journal, harder abstracts gain nothing. And citations are only one outcome. Clear abstracts may still help with public reach, policy use, peer review and teaching, none of which this study measures. The practical message is narrower: making an abstract simpler is unlikely to cost citations, and making it denser is unlikely to earn them.
4.3 AI writing tools and the post-2023 shift
The sharpest finding is the change since 2023. After eight flat years, abstract readability fell by about 8 points in three years. The fall came through longer words, and it arrived together with a rise in the vocabulary that AI tools favour. Words like “underscore” and “delve” became 18 to 28 times more common. Yet the flagged words themselves account for almost none of the drop: abstracts used longer words across the board.
This fits earlier evidence that a large share of recent abstracts are written or polished with AI help (Kobak et al., 2025; Liang et al., 2024). It adds a new point: this help is not making abstracts easier to read. By the Flesch measure, it is making them harder. If AI tools are used to “improve” writing, they seem to swap plain words for longer, more formal ones.
So far, this shift has not hurt citations. Abstracts with AI-style words are cited slightly more. One possible reason is selection: authors who use AI tools may differ in experience, funding or first language. We did not collect the data needed to test this, so it remains a guess. Whether AI-polished writing affects how papers are read and used over the longer term remains an open question.
5. Limitations
Correlation, not cause. The design cannot show that readability changes citations. Readability may stand in for topic, novelty, journal type or author experience. The journal-level test in Section 3.1 supports the journal explanation, but cannot rule out other differences between journals.
Rough measures. Flesch Reading Ease was built for general English. It counts syllables, so it treats technical terms as hard even for expert readers. Dale-Chall and Flesch-Kincaid scores, reported as checks, show the same patterns, but all three formulas are rough guides to how hard text is for expert readers.
Abstracts only. Full texts may differ in readability from their abstracts.
Open access only. Only open-access papers were sampled. Paywalled papers, which include many highly cited journals, may behave differently. The post-2023 decline does appear across all five open-access types (Table 3).
Young citations after 2023. When the data were collected, papers from 2023 had had about three years to be cited, and papers from 2025 less than two. RQ4 results should be treated as early evidence.
AI vocabulary is a proxy. The word list captures one visible trace of AI use. Many AI-assisted abstracts will contain none of these words, and some human writers use them. The measure works across thousands of papers, not for single papers.
Equal weighting. Every field and year has the same sample size. Pooled figures weight small fields as heavily as large ones. Per-field results (Figure 5) are the fairest summary.
Publication lag. Many 2023 papers were written before ChatGPT’s release, so the 2023 figures blend both periods. 2024 and 2025 are the clearer post-ChatGPT years.
6. Conclusion
Easier-to-read papers do not get more citations. Across 26,439 open-access papers and 26 fields, harder abstracts are cited more, but mainly because they appear in more technical and more cited journals. Within the same journal, readability makes little difference.
The bigger story is what has happened since 2023. After years of stability, abstracts have become much harder to read, through longer words, at the same time as AI-style vocabulary spread through the literature. Tools often sold as ways to improve writing appear to be pushing scientific prose further from plain English. Future work should follow these papers as their citations mature, test the pattern on full texts and paywalled journals, and ask whether denser AI-polished writing changes who reads and uses research.
References
Dowling, M., Hammami, H. and Zreik, O. (2018). Easy to read, easy to cite? Economics Letters, 173, 100 to 103.
Flesch, R. (1948). A new readability yardstick. Journal of Applied Psychology, 32(3), 221 to 233.
Kobak, D., González-Márquez, R., Horvát, E.-Á. and Lause, J. (2025). Delving into LLM-assisted writing in biomedical publications through excess vocabulary. Science Advances. Preprint: arXiv 2406.07016.
Lei, L. and Yan, S. (2016). Readability and citations in information science: evidence from abstracts and articles of four journals (2003 to 2012). Scientometrics, 108(3), 1155 to 1169.
Liang, W. et al. (2024). Mapping the increasing use of LLMs in scientific papers. Conference on Language Modeling (COLM).
Plavén-Sigray, P., Matheson, G. J., Schiffler, B. C. and Thompson, W. H. (2017). The readability of scientific texts is decreasing over time. eLife, 6, e27725.
Priem, J., Piwowar, H. and Orr, R. (2022). OpenAlex: A fully-open index of scholarly works, authors, venues, institutions, and concepts. arXiv 2205.01833.
Data and code availability
Data were drawn from the OpenAlex API on 23 September 2026 using a fixed random seed for each field and year. The analysis table, Python code and figures are available from the author on reasonable request. OpenAlex data are freely available at openalex.org under a CC0 licence.
Appendix A. AI-style word list
The 37 word forms counted in Section 2.4, grouped by root. Matching ignores capital letters and counts whole words only.
Root | Forms counted |
|---|---|
delve | delve, delves, delved, delving |
underscore | underscore, underscores, underscored, underscoring |
showcase | showcase, showcases, showcased, showcasing |
intricate | intricate, intricacies, intricately |
meticulous | meticulous, meticulously |
unveil | unveil, unveils, unveiled, unveiling |
garner | garnered, garnering |
realm | realm, realms |
boast | boast, boasts |
elucidate | elucidate, elucidates |
single forms | pivotal, commendable, noteworthy, multifaceted, nuanced, seamlessly, invaluable, tapestry |
Declaration of competing interest
The author is the founder of Writing Studio, an AI academic writing company.
© 2026 Philip Ghezelbash. Published by Writing Studio.